Routine explanation -10-blob_detection color recognition
Video tutorial 4 - Color recognition: https://singtown.com/learn/49993/
This routine is 10-Color_Ttracking-blob_detection\ The goal of this routine is to implement color recognition with OpenMV. openmv can recognize multiple colors simultaneously.
# Blob Detection Example
#
# 这个例子展示了如何使用find_blobs函数来查找图像中的颜色色块。这个例子特别寻找深绿色的物体。

import sensor, image, time

# 为了使色彩追踪效果真的很好,你应该在一个非常受控制的照明环境中。
green_threshold   = (   0,   80,  -70,   -10,   -0,   30)
# 设置绿色的阈值,括号里面的数值分别是L A B 的最大值和最小值(minL, maxL, minA,
# maxA, minB, maxB),LAB的值在图像左侧三个坐标图中选取。如果是灰度图,则只需
# 设置(min, max)两个数字即可。

# 你可能需要调整上面的阈值来跟踪绿色的东西…
# 在Framebuffer中选择一个区域来复制颜色设置。

sensor.reset() # 初始化sensor

sensor.set_pixformat(sensor.RGB565) # use RGB565.
#设置图像色彩格式,有RGB565色彩图和GRAYSCALE灰度图两种

sensor.set_framesize(sensor.QQVGA) # 使用QQVGA的速度。
#设置图像像素大小

sensor.skip_frames(10) # 让新的设置生效。
sensor.set_auto_whitebal(False) # turn this off.
#关闭白平衡。白平衡是默认开启的,在颜色识别中,需要关闭白平衡。
clock = time.clock() # 跟踪FPS帧率

while(True):
    clock.tick() # 追踪两个snapshots()之间经过的毫秒数.
    img = sensor.snapshot() # 拍一张照片并返回图像。

    blobs = img.find_blobs([green_threshold])
    #find_blobs(thresholds, invert=False, roi=Auto),thresholds为颜色阈值,
    #是一个元组,需要用括号[ ]括起来。invert=1,反转颜色阈值,invert=False默认
    #不反转。roi设置颜色识别的视野区域,roi是一个元组, roi = (x, y, w, h),代表
    #从左上顶点(x,y)开始的宽为w高为h的矩形区域,roi不设置的话默认为整个图像视野。
    #这个函数返回一个列表,[0]代表识别到的目标颜色区域左上顶点的x坐标,[1]代表
    #左上顶点y坐标,[2]代表目标区域的宽,[3]代表目标区域的高,[4]代表目标
    #区域像素点的个数,[5]代表目标区域的中心点x坐标,[6]代表目标区域中心点y坐标,
    #[7]代表目标颜色区域的旋转角度(是弧度值,浮点型,列表其他元素是整型),
    #[8]代表与此目标区域交叉的目标个数,[9]代表颜色的编号(它可以用来分辨这个
    #区域是用哪个颜色阈值threshold识别出来的)。
    if blobs:
    #如果找到了目标颜色
        for b in blobs:
        #迭代找到的目标颜色区域
            # Draw a rect around the blob.
            img.draw_rectangle(b[0:4]) # rect
            #用矩形标记出目标颜色区域
            img.draw_cross(b[5], b[6]) # cx, cy
            #在目标颜色区域的中心画十字形标记
            print(b[5], b[6])
            #输出目标物体中心坐标

        print(clock.fps()) # 注意: 当连接电脑后,OpenMV会变成一半的速度。当不连接电脑,帧率会增加。
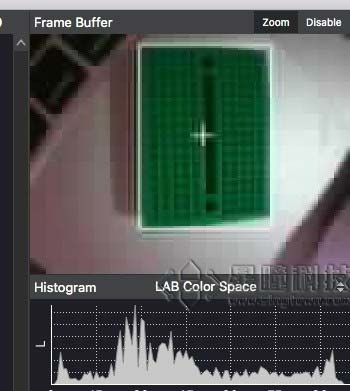
Run the program:\

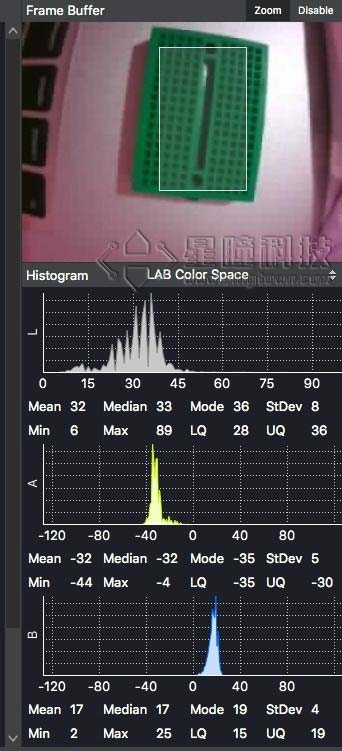
How to select thresholds:\
- First find the target color in the camera and circle a rectangle on the target color in the framebuffer by left-clicking

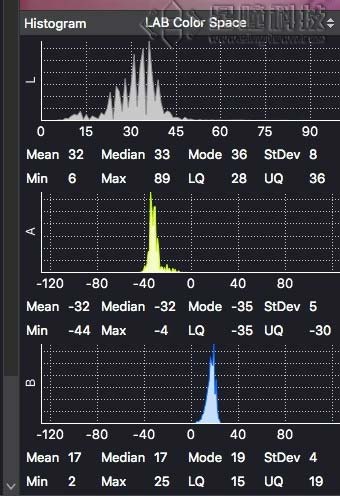
- On the graph below the framebuffer, select LAB Color Space.

- The three coordinate plots respectively represent the LAB values in the circled rectangular area, and select the maximum and minimum values of the three coordinate plots
So (0, 50, -55, 0, 0, 35)
Singtown Technology OpenMV official Chinese document function explanation:
